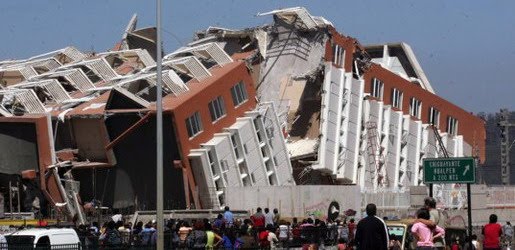
Earthquake
An earthquake (also known as a quake, tremor or temblor) is the result of a sudden release of energy in the Earth's crust that creates seismic waves.
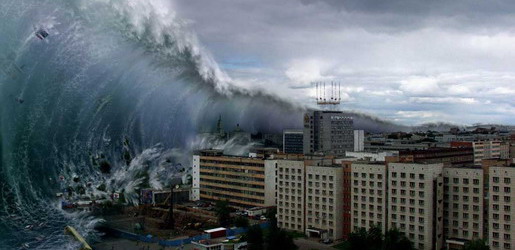
Tsunami
A tsunami also called a tsunami wave train, and at one time incorrectly referred to as a tidal wave, is a series of water waves caused by the displacement of a large volume of a body of water, usually an ocean, though it can occur in large lakes.
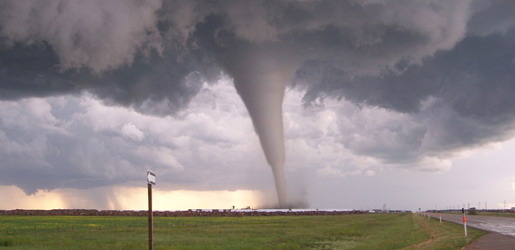
Tornado
A tornado (often referred to as a twister or, erroneously, a cyclone) is a violent, dangerous, rotating column of air that is in contact with both the surface of the earth and a cumulonimbus cloud or, in rare cases, the base of a cumulus cloud.
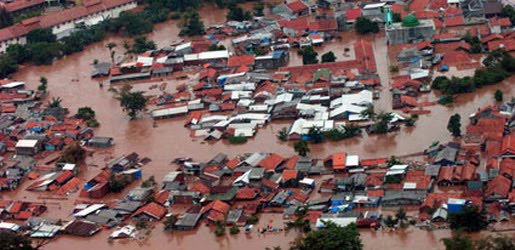
Floods
A flood is an overflow of an expanse of water that submerges land. The EU Floods directive defines a flood as a temporary covering by water of land not normally covered by water
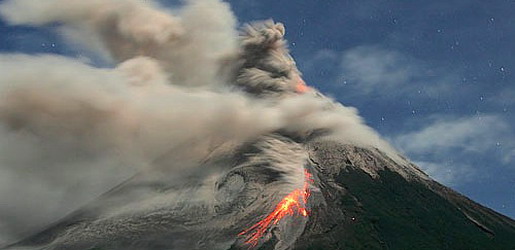
Volcanic Eruptions
Volcanoes can cause widespread destruction and consequent disaster through several ways. The effects include the volcanic eruption itself that may cause harm following the explosion of the volcano or the fall of rock.
Health Effects of Heat Wave
12:50 AM
Hyperthermia, also known as heat stroke, becomes commonplace during periods of sustained high temperature and humidity. Sweating is absent from 84%–100% of those affected. Older adults, very young children, and those who are sick or overweight are at a higher risk for heat-related illness. The chronically ill and elderly are often taking prescription medications (e.g., diuretics, anticholinergics, antipsychotics, and antihypertensives) that interfere with the body's ability to dissipate heat.
Heat edema presents as a transient swelling of the hands, feet, and ankles and is generally secondary to increased aldosterone secretion, which enhances water retention. When combined with peripheral vasodilation and venous stasis, the excess fluid accumulates in the dependent areas of the extremities. The heat edema usually resolves within several days after the patient becomes acclimated to the warmer environment. No treatment is required, although wearing support stocking and elevating the affected legs with help minimize the edema.
Heat rash, also known as prickly heat, is a maculopapular rash accompanied by acute inflammation and blocked sweat ducts. The sweat ducts may become dilated and may eventually rupture, producing small pruritic vesicles on an erythematous base. Heat rash affects areas of the body covered by tight clothing. If this continues for a duration of time it can lead to the development of chronic dermatitis or a secondary bacterial infection. Prevention is the best therapy. It is also advised to wear loose-fitting clothing in the heat. However, once heat rash has developed, the initial treatment involves the application of chlorhexidine lotion to remove any desquamated skin. The associated itching may be treated with topical or systemic antihistamines. If infection occurs a regimen of antibiotics is required.
Heat cramps are painful, often severe, involuntary spasms of the large muscle groups used in strenuous exercise. Heat cramps tend to occur after intense exertion. They usually develop in people performing heavy exercise while sweating profusely and replenishing fluid loss with non-electrolyte containing water. This is believed to lead to hyponatremia that induces cramping in stressed muscles. Rehydration with salt-containing fluids provides rapid relief. Patients with mild cramps can be given oral .2% salt solutions, while those with severe cramps require IV isotonic fluids. The many sport drinks on the market are a good source of electrolytes and are readily accessible.
Heat syncope is related to heat exposure that produces orthostatic hypotension. This hypotension can precipitate a near-syncopal episode. Heat syncope is believed to result from intense sweating, which leads to dehydration, followed by peripheral vasodilation and reduced venous blood return in the face of decreased vasomotor control. Management of heat syncope consists of cooling and rehydration of the patient using oral rehydration therapy (sport drinks) or isotonic IV fluids. People who experience heat syncope should avoid standing in the heat for long periods of time. They should move to a cooler environment and lie down if they recognize the initial symptoms. Wearing support stockings and engaging in deep knee-bending movements can help promote venous blood return.
Heat exhaustion is considered by experts to be the forerunner of heat stroke (hyperthermia). It may even resemble heat stroke, with the difference being that the neurologic function remains intact. Heat exhaustion is marked by excessive dehydration and electrolyte depletion. Symptoms may include headache, nausea, and vomiting, dizziness, tachycardia, malaise, and myalgia. Definitive therapy includes removing patients from the heat and replenishing their fluids. Most patients will require fluid replacement with IV isotonic fluids at first. The salt content is adjusted as necessary once the electrolyte levels are known. After discharge from the hospital, patients are instructed to rest, drink plenty of fluids for 2–3 hours, and avoid the heat for several days. If this advice is not followed it may then lead to heat stroke.
One public health measure taken during heat waves is the setting-up of air-conditioned public cooling centers.
Mortality
Heat waves are the most lethal type of weather phenomenon, overall. Between 1992 and 2001, deaths from excessive heat in the United States numbered 2,190, compared with 880 deaths from floods and 150 from hurricanes. The average annual number of fatalities directly attributed to heat in the United States is about 400. The 1995 Chicago heat wave, one of the worst in US history, led to approximately 600 heat-related deaths over a period of five days. Eric Klinenberg has noted that in the United States, the loss of human life in hot spells in summer exceeds that caused by all other weather events combined, including lightning, rain, floods, hurricanes, and tornadoes. Despite the dangers, Scott Sheridan, professor of geography at Kent State University, found that less than half of people 65 and older abide by heat-emergency recommendations like drinking lots of water. In his study of heat-wave behavior, focusing particularly on seniors in Philadelphia, Phoenix, Toronto, and Dayton, Ohio, he found that people over 65 "don't consider themselves seniors." "Heat doesn't bother me much, but I worry about my neighbors," said one of his older respondents. According to the Agency for Health care Research and Quality, about 6,200 Americans are hospitalized each summer due to excessive heat, and those at highest risk are poor, uninsured or elderly.
- Underreporting and "Harvesting" effect
The number of heat fatalities is likely highly underreported due to lack of reports and misreports. Part of the mortality observed during a heat wave, however, can be attributed to a so-called "harvesting effect", a term for a short-term forward mortality displacement. It has been observed that for some heat waves, there is a compensatory decrease in overall mortality during the subsequent weeks after a heat wave. Such compensatory reduction in mortality suggests that heat affects especially those so ill that they "would have died in the short term anyway".
Psychological and sociological effects
In addition to physical stress, excessive heat causes psychological stress, to a degree which affects performance, and is also associated with an increase in violent crime.
Power outage
Heat waves often lead to electricity spikes due to increased air conditioning use, which can create power outages, exacerbating the problem. During the 2006 North American heat wave, thousands of homes and businesses went without power, especially in California. In Los Angeles, electrical transformers failed, leaving thousands without power for as long as five days. The 2009 South Eastern Australia Heat Wave caused the city of Melbourne, Australia to experience some major power disruptions which left over half a million people without power as the heat wave blew transformers and overloaded the power grid.
Wildfires
If a heat wave occurs during a drought, which dries out vegetation, it can contribute to bushfires and wildfires. During the disastrous heat wave that struck Europe in 2003, fires raged through Portugal, destroying over 3,010 square kilometres (740,000 acres) of forest and 440 square kilometres (110,000 acres) of agricultural land and causing an estimated €1 billion worth of damage. High end farmlands have irrigation systems to back up crops with.
Physical damage
Heat waves can and do cause roads and highways to buckle, water lines to burst, power transformers to detonate, causing fires. See the 2006 North American heat wave article about heat waves causing physical damage.
How Heat Wave Occur
12:48 AM
In the summer in warm climates, an area of high pressure with little or no rain or clouds, the air and ground easily heats to excess. A static high pressure area can impose a very persistent heat wave.
The position of the jet stream allows air on one side to be considerably warmer than the other side. Heat waves are far more common and more severe on the warm side and at times an unusual position of the jet stream places unusual warmth in an unusual place for hot weather, and imposes a heat wave. El Niño and La Niña (opposite reaction to El Niño) can severely disrupt the positions of the jet streams.
Large desert zones and dry areas are more likely to get extreme heat because there is rarely any high cloud cover with very low humidity.
Winds from hot deserts typically push hot, dry air towards areas normally cooler than during a heat wave. During the summer an area that has no geographic features that might cool winds that originate in the hot deserts get little mitigation, especially near the summer solstice when long days and a high sun would create warm conditions even without the transport of hot air from other locations. Should such a hot air mass travel above a large body of water, as a sirocco of Saharan origin crossing the Mediterranean sea, it likely picks up much water vapor with a reduction in temperature but far greater humidity that makes the original desert air little less moderate as demonstrated in a high heat index. Heat waves can also come from air originating over tropical seas penetrating far into the middle latitudes heating further overland, as often occurs in the eastern United States and southeastern Canada. The heat island created by dense urbanization of large cities only exacerbate heat waves because of the weakness of night-time cooling.
What is Heat Wave
12:45 AM

Definitions of Heat Wave
The definition recommended by the World Meteorological Organization is when the daily maximum temperature of more than five consecutive days exceeds the average maximum temperature by 5 Celsius degrees (9 Fahrenheit degrees), the normal period being 1961–1990.
A formal, peer-reviewed definition from the Glossary of Meteorology is:
- A period of abnormally and uncomfortably hot and usually humid weather.
- To be a heat wave such a period should last at least one day, but conventionally it lasts from several days to several weeks. In 1900, A. T. Burrows more rigidly defined a “hot wave” as a spell of three or more days on each of which the maximum shade temperature reaches or exceeds 90 °F (32 °C). More realistically, the comfort criteria for any one region are dependent upon the normal conditions of that region.
In the Netherlands, a heat wave is defined as period of at least 5 consecutive days in which the maximum temperature in De Bilt exceeds 25 °C (77 °F), provided that on at least 3 days in this period the maximum temperature in De Bilt exceeds 30 °C (86 °F). This definition of a heat wave is also used in Belgium and Luxembourg.
In Denmark a heat wave is defined as a period of at least 3 consecutive days of which period the average maximum temperature across more than fifty percent of the country exceeds 28 °C.
In the United States, definitions also vary by region; however, a heat wave is usually defined as a period of at least two or more days of excessively hot weather. In the Northeast, a heat wave is typically defined as three consecutive days where the temperature reaches or exceeds 90 °F (32 °C), but not always as this is ties in with humidity levels to determine a heat index threshold. The same does not apply to drier climates. A heat storm is a Californian term for an extended heat wave. Heat storms occur when the temperature reaches 100 °F (38 °C) for three or more consecutive days over a wide area (tens of thousands of square miles). The National Weather Service issues heat advisories and excessive heat warnings when unusual periods of hot weather are expected.
In Adelaide, Australia, a heat wave is defined as five consecutive days at or above 35 °C (95 °F), or three consecutive days at or over 40 °C (104 °F).
List of Costly - Deadly Hailstorms
12:39 AM
This is a list of the costliest or deadliest hailstorms on record.
| Date | Location | Incident |
|---|---|---|
| Circa 9th century | Roopkund, Uttarakhand, India | Several hundred pilgrims were killed by a massive hailstorm in Roopkund. |
| May 24 1937 | Belgrade, Yugoslavia | |
| January 1 1947 | Sydney, Australia | 1947 Sydney hailstorm |
| December 1967 | Los Angeles County, California, USA | A hailstorm hit the county, blanketing the region much like a snowstorm. The storm also produced lightning, and one bolt struck an oil tank in Manhattan Beach, causing an explosion that covered much of the South Bay with the oil. The next hailstorm to hit the area was in 1979. |
| July 1979 | Fort Collins, Colorado, USA | A violent forty-minute hailstorm bombed Fort Collins, CO, with hail up to grapefruit size. Two thousand homes and 2500 automobiles were severely damaged, and about 25 persons were injured, mainly when hit on the head by the huge stones. A three month old baby died of a fractured skull, struck by a large hailstone while being carried by his mother, who was running with him to seek cover. (The Weather Channel) |
| 12 July 1984 | Munich, Bavaria, Germany | Tennis ball sized hail fell on Munich and surrounding areas on this date. It was the greatest loss event in the history of the German insurance industry: 200,000 cars were damaged and the storm cost an estimated 166 million Deutschmark. For years afterwards people jokingly referred to those cars whose bodywork was not repaired as 'Munich Design'. |
| 18 January 1985 | Brisbane, Queensland, Australia | Late in the afternoon, a supercell thunderstorm swept in from the west dropping hailstones as large as 6 cm over parts of the city. A wind gust of over 180 km/h was recorded at Brisbane airport and 57mm of rain recorded in 15 minutes at the same location. The 30 minutes of destruction caused $AU300 million ($AU1.7 billion in 2007 adjusted dollars) damage to vehicles and buildings. This rates as the 5th most costly insured event in Australia since 1968. |
| 11 July 1990 | Denver, Colorado, USA | Softball-sized hail destroyed roofs and cars, causing $625 million in total damage ($1 billion in damage adjusted to 2007 dollars). |
| 7 September 1991 | Calgary, Alberta, Canada | A Labour Day thunderstorm caused $342 million worth of insurable damage in Calgary. Thirteen additional hailstorms between 1981 and 1998 caused an estimated $600 million in damage in the Calgary area alone. |
| June 19, 1992 | Wichita, Kansas, USA | Two batches of severe thunderstorms, occurring within 6 hours of each other, dumped hailstones up to 4.5 inches in diameter across Sedgwick, including the city of Wichita, and surrounding counties in south-central Kansas. Over 10,000 homes were damaged. The hail left wheat fields in a near total loss. Estimated property damage totaled $500 million with crop damage at $100 million. The thunderstorm episode ranks as one of the worst ever to hit Kansas. |
| 5 May 1995 | Dallas and Fort Worth, Texas, USA | The 1995 Mayfest Storm produced $1.1 billion insured losses, and total storm damage was reported at around $2 billion. The storms produced hail about the size of softballs. |
| 14 April 1999 | Sydney, New South Wales, Australia | 1999 Sydney hailstorm: 20,000 properties and 40,000 vehicles were damaged during the storm with more than 25 aircraft damaged at Sydney Airport. One person was killed while fishing after getting struck by lightning and several other people were injured. At $AU1.5 billion ($AU3.3 billion in 2007 adjusted dollars), it was the costliest hailstorm to hit an Australian populated city. Largest stone measured was 9.5 cm. |
| 29 March 2000 | Lake Worth, Texas, USA | The last known hail fatality in the United States occurs. The victim was Juan Oseguera, a nineteen-year-old man who died from head injuries after being hit by a softball sized hailstone in Lake Worth. |
| 18 May 2000 | McHenry, Lake, northern Kane, and northern Cook County, Illinois, USA | $572 million. Golfball-, baseball-, and softball-sized hail damaged roofs, cars, patio furniture, skylights, and windows in the area's worst and most widespread hailstorm in 30 years. Around 100,000 homes lost power. Hail was 3 inches (76 mm) deep in many areas. There were 100 canceled flights, and train service was disrupted. |
| 10 April 2001 | St. Louis, Missouri, USA | $2.0 billion+. The costliest hailstorm in US history struck the I-70 corridor of eastern Kansas, across Missouri, into southwestern Illinois. |
| 19 July 2002 | Henan Province, the People's Republic of China | 25 dead and hundreds injured. |
| 22 June 2003 | Aurora, Nebraska, USA | The largest hailstone on record at the time, it had a 7-inch (180 mm) diameter and a circumference of 18.75 inches (476 mm). |
| 20–21 April 2006 | San Marcos, Texas, USA | Hail of sizes up to 10 cm results in 10,000 auto claims, 7,000 homeowner and commercial property claims ranging between $100–160 million insured losses. One woman was hospitalized. The storm was especially costly at the San Marcos Outlet Malls and a nearby Toyota dealership. |
| 28-29 Jun 2006 | Villingen-Schwenningen and suburbs, Baden-Württemberg, Germany | Supercell thunderstorms, severe damage by grapefruit-sized hailstones, causing € 150 million damage, more than 100 injuries. |
| 9 December 2007 | Sydney, Australia | Supercell thunderstorms caused immense damage in the North and Western Suburbs of Sydney. Worst hit were the suburbs of Blacktown, Castle Hill and neighbouring Baulkham Hills. Hail stones the size of golf balls damaged cars, windows and homes. |
| 22 March 2010 | Perth, Australia | The hailstorm that struck after a long dry spell lasted only a few minutes but caused damage to many houses, a number of hospitals and schools, and an airport terminal. The storm damaged thousands of cars, cut power lines and left 150,000 houses and many traffic lights without power. The storm also caused a landslip at King's Park. |
| 10,16 May 2010 | Oklahoma City, Oklahoma, USA | Two major hailstorms separated by less than a week caused damage to large portions of the Oklahoma City metropolitan area. Damages from the first storm caused an estimated $595 million (USD) damage, and the second storm was expected to be around the same, totaling around $1 billion in damages. |
| 12 July 2010 | Calgary, Alberta, Canada | The hailstorm that pounded Calgary on July 12 eclipsed the record originally set in 1991, with insurable damages totalling at least $400 million, excluding agricultural crop damage. The storm brought hail as wide as four centimetres (over 1.5 inches). |
Hail Storms Size and Terminal Velocity
12:45 AM
The size of hail stones is best determined by measuring their diameter with a ruler. In the absence of a ruler, hail stone size is often visually estimated by comparing its size to that of known objects, such as coins. Below is a table of commonly used objects for this purpose. Note that using the objects such as hen's eggs, peas, and marbles for comparing hailstone sizes is often inaccurate, due to their varied dimensions. The UK organisation, TORRO, also scales for both hailstones and hailstorms. When observed at an airport, METAR code is used within a surface weather observation which relates to the size of the hail stone. Within METAR code, GR is used to indicate larger hail, of a diameter of at least 0.25 inches (6.4 mm). GR is derived from the French word grêle. Smaller-sized hail, as well as snow pellets, use the coding of GS, which is short for the French word grésil.
![]() Terminal velocity of hail, or the speed at which hail is falling when it strikes the ground, varies by the diameter of the hail stones. A hail stone of 1 centimetre (0.39 in) in diameter falls at a rate of 9 metres per second (20 mph), while stones the size of 8 centimetres (3.1 in) in diameter fall at a rate of 48 metres per second (110 mph). Hail stone velocity is dependent on the size of the stone, friction with air it is falling through, the motion of wind it is falling through, collisions with raindrops or other hail stones, and melting as the stones fall through a warmer atmosphere.
Terminal velocity of hail, or the speed at which hail is falling when it strikes the ground, varies by the diameter of the hail stones. A hail stone of 1 centimetre (0.39 in) in diameter falls at a rate of 9 metres per second (20 mph), while stones the size of 8 centimetres (3.1 in) in diameter fall at a rate of 48 metres per second (110 mph). Hail stone velocity is dependent on the size of the stone, friction with air it is falling through, the motion of wind it is falling through, collisions with raindrops or other hail stones, and melting as the stones fall through a warmer atmosphere.
| United States | Canada | |
|---|---|---|
| Dime | 0.705 inches (17.9 mm) | 18.03 millimetres (0.710 in) |
| Cent (or "Penny") | 0.75 inches (19 mm) | 19.05 millimetres (0.750 in) |
| Five cents (Nickel) | 0.88 inches (22 mm) | 21.2 millimetres (0.83 in) |
| Twenty-five cents (Quarter dollar) | 1.00 inch (25 mm) | 23.88 millimetres (0.940 in) |
| Dollar (Loonie) | 1.043 inches (26.5 mm) | 26.5 millimetres (1.04 in) |
| 50 Cents/Half Dollar | 1.25 inches (32 mm) | 27.13 millimetres (1.068 in) |
| Two Dollars (Toonie) | 28 millimetres (1.1 in) |
| Object | Diameter |
|---|---|
| Pea | 0.25 inches (6.4 mm) |
| Marble (small) | 0.50 inches (13 mm) |
| Mothball | 0.50 inches (13 mm) |
| Grape (small) | 0.62 inches (16 mm) |
| Olive (large) | 0.75 inches (19 mm) |
| Shooter Marble | 0.75 inches (19 mm) |
| Walnut/Ping-pong ball | 1.50 inches (38 mm) |
| Ping-pong ball | 1.60 inches (41 mm) |
| Squash ball | 1.65 inches (42 mm) |
| Golf ball | 1.75 inches (44 mm) |
| Hen egg | 2.00 inches (51 mm) |
| Billiards (Pool) Ball | 2.25 inches (57 mm) |
| Orange (Valencia/sweet) | 2.38 inches (60 mm) |
| Tennis ball | 2.50 inches (64 mm) |
| Baseball | 2.75 inches (70 mm) |
| Cricket ball | 2.80 inches (71 mm) |
| Teacup | 3.00 inches (76 mm) |
| Grapefruit | 4.00 inches (102 mm) |
| Softball | 4.50 inches (114 mm) |
| Melon (small) | 4.75 inches (121 mm) |
| Computer CD | 5.00 inches (127 mm) |
| Cantaloupe | 6.50 inches (165 mm) |
| 45 RPM Phonograph Record | 7.00 inches (178 mm) |
| Volleyball | 8.00 inches (203 mm) |
| Bowling Ball | 8.25 inches (210 mm) |
Hail Storms Climatology
12:44 AM
Hail occurs most frequently within continental interiors at mid-latitudes and is less common in the tropics, despite a much higher frequency of thunderstorms than in the midlatitudes. Hail is also much more common along mountain ranges because mountains force horizontal winds upwards (known as orographic lifting), thereby intensifying the updrafts within thunderstorms and making hail more likely. One of the more common regions for large hail is across mountainous northern India, which reported one of the highest hail-related death tolls on record in 1888. China also experiences significant hailstorms. Central Europe experiences also a lot of hailstorms. Popular regions for hailstorms are southern and western Germany, northern and eastern France and southern and eastern BeNeLux. In south-eastern Europe, Croatia and Serbia experience frequent occurrences of hail.
In North America, hail is most common in the area where Colorado, Nebraska, and Wyoming meet, known as "Hail Alley." Hail in this region occurs between the months of March and October during the afternoon and evening hours, with the bulk of the occurrences from May through September. Cheyenne, Wyoming is North America's most hail-prone city with an average of nine to ten hailstorms per season.Hail Storms Short-Term Detection
12:42 AM
Weather radar is a very useful tool to detect the presence of hail producing thunderstorms. However, radar data has to be complemented by a knowledge of current atmospheric conditions which can allow one to determine if the current atmosphere is conducive to hail development.
Modern radar scans many angles around the site. Reflectivity values at multiple angles above ground level in a storm are proportional to the precipitation rate at those levels. Summing reflectivities in the Vertically Integrated Liquid or VIL, gives the liquid water content in the cloud. Research shows that hail development in the upper levels of the storm is related to the evolution of VIL. VIL divided by the vertical extent of the storm, called VIL density, has a relationship with hail size, although this varies with atmospheric conditions and therefore is not highly accurate. Traditionally, hail size and probability can be estimated from radar data by computer using algorithms based on this research. Some algorithms include the height of the freezing level to estimate the melting of the hailstone and what would be left on the ground.
Certain patterns of reflectivity are important clues for the meteorologist as well. The three body scatter spike is an example. This is the result of energy from the radar hitting hail and being deflected to the ground, where they deflect back to the hail and then to the radar. The energy took more time to go from the hail to the ground and back, as opposed to the energy that went direct from the hail to the radar, and the echo is further away from the radar than the actual location of the hail on the same radial path, forming a cone of weaker reflectivities.
More recently, the polarization properties of weather radar returns have been analyzed to differentiate between hail and heavy rain. The use of differential reflectivity (Zdr), in combination with horizontal reflectivity (Zh) has led to a variety of hail classification algorithms. Visible satellite imagery is beginning to be used to detect hail, but false alarm rates remain high using this method.Hail Storms Formation
12:39 AM

Hail forms in strong thunderstorm clouds, particularly those with intense updrafts, high liquid water content, great vertical extent, large water droplets, and where a good portion of the cloud layer is below freezing 0 °C (32 °F). These type of strong updrafts can also indicate the presence of a tornado. The growth rate is maximized where air is near a temperature of −13 °C (9 °F).
Layer nature of the hailstones
Like other precipitation in cumulonimbus clouds hail begins as water droplets. As the droplets rise and the temperature goes below freezing, they become supercooled water and will freeze on contact with condensation nuclei. A cross-section through a large hailstone shows an onion-like structure. This means the hailstone is made of thick and translucent layers, alternating with layers that are thin, white and opaque. Former theory suggested that hailstones were subjected to multiple descents and ascents, falling into a zone of humidity and refreezing as they were uplifted. This up and down motion was thought to be responsible for the successive layers of the hailstone. New research (based on theory and field study) has shown this is not necessarily true.
The storm's updraft, with upwardly directed wind speeds as high as 110 miles per hour (180 km/h), blow the forming hailstones up the cloud. As the hailstone ascends it passes into areas of the cloud where the concentration of humidity and supercooled water droplets varies. The hailstone’s growth rate changes depending on the variation in humidity and supercooled water droplets that it encounters. The accretion rate of these water droplets is another factor in the hailstone’s growth. When the hailstone moves into an area with a high concentration of water droplets, it captures the latter and acquires a translucent layer. Should the hailstone move into an area where mostly water vapour is available, it acquires a layer of opaque white ice.
Furthermore, the hailstone’s speed depends on its position in the cloud’s updraft and its mass. This determines the varying thicknesses of the layers of the hailstone. The accretion rate of supercooled water droplets onto the hailstone depends on the relative velocities between these water droplets and the hailstone itself. This means that generally the larger hailstones will form some distance from the stronger updraft where they can pass more time growing. As the hailstone grows it releases latent heat, which keeps its exterior in a liquid phase. Undergoing 'wet growth', the outer layer is sticky, or more adhesive, so a single hailstone may grow by collision with other smaller hailstones, forming a larger entity with an irregular shape.
The hailstone will keep rising in the thunderstorm until its mass can no longer be supported by the updraft. This may take at least 30 minutes based on the force of the updrafts in the hail-producing thunderstorm, whose top is usually greater than 10 km high. It then falls toward the ground while continuing to grow, based on the same processes, until it leaves the cloud. It will later begin to melt as it passes into air above freezing temperature.
Thus, a unique trajectory in the thunderstorm is sufficient to explain the layer-like structure of the hailstone. The only case in which we can discuss mutiple trajectories is in a multicellular thunderstorm where the hailstone may be ejected from the top of the "mother" cell and captured in the updraft of a more intense "daughter cell". This however is an exceptional case.
Factors favoring hail
Hail is most common within continental interiors of the mid-latitudes, as hail formation is considerably more likely when the freezing level is below the altitude of 11,000 feet (3,400 m). Movement of dry air into strong thunderstorms over continents can increase the frequency of hail by promoting evaporational cooling which lowers the freezing level of thunderstorm clouds giving hail a larger volume to grow in. Accordingly, hail is actually less common in the tropics despite a much higher frequency of thunderstorms than in the mid-latitudes because the atmosphere over the tropics tends to be warmer over a much greater depth. Hail in the tropics occurs mainly at higher elevations.
Hail growth becomes vanishingly small when air temperatures fall below −30 °C (−22 °F) as supercooled water droplets become rare at these temperatures. Around thunderstorms, hail is most likely within the cloud at elevations above 20,000 feet (6,100 m). Between 10,000 feet (3,000 m) and 20,000 feet (6,100 m), 60 percent of hail is still within the thunderstorm, though 40 percent now lies within the clear air under the anvil. Below 10,000 feet (3,000 m), hail is equally distributed in and around a thunderstorm to a distance of 2 nautical miles (3.7 km).What is Hail Storms
12:35 AM

Hail is a form of solid precipitation which consists of balls or irregular lumps of ice, that are individually called hail stones. Hail stones on Earth consist mostly of water ice and measure between 5 millimetres (0.20 in) and 200 millimetres (7.9 in) in diameter, with the larger stones coming from severe thunderstorms. The METAR reporting code for hail 5 millimetres (0.20 in) or greater in diameter is GR, while smaller hailstones and graupel are coded GS. Hail is possible within most thunderstorms as it is produced by cumulonimbi (thunderclouds), and within 2 nautical miles (3.7 km) of the parent storm. Hail formation requires environments of strong, upward motion of air with the parent thunderstorm (similar to tornadoes) and lowered heights of the freezing level. Hail is most frequently formed in the interior of continents within the mid-latitudes of Earth, with hail generally confined to higher elevations within the tropics.
There are methods available to detect hail-producing thunderstorms using weather satellites and weather radar imagery. Hail stones generally fall at higher speeds as they grow in size, though complicating factors such as melting, friction with air, wind, and interaction with rain and other hail stones can slow their descent through Earth's atmosphere. Severe weather warnings are issued for hail when the stones reach a damaging size, as it can cause serious damage to man-made structures and, most commonly, farmers' crops.
Definition
Any thunderstorm which produces hail that reaches the ground is known as a hailstorm. Hail has a diameter of 5 millimetres (0.20 in) or more. Hail stones can grow to 15 centimetres (6 in) and weigh more than 0.5 kilograms (1.1 lb).
Unlike ice pellets, hail stones are layered and can be irregular and clumped together. Hail is composed of transparent ice or alternating layers of transparent and translucent ice at least 1 millimetre (0.039 in) thick, which are deposited upon the hail stone as it cycles through the cloud, suspended aloft by air with strong upward motion until its weight overcomes the updraft and falls to the ground. Although the diameter of hail is varied, in the United States, the average observation of damaging hail is between 2.5 cm (1 in) and golf ball-sized (1.75 in).
Stones larger than 2 cm (0.75 in) are usually considered large enough to cause damages. The Meteorological Service of Canada will issue severe thunderstorm warnings when hail that size or above is expected. The US National Weather Service has a 2.5 cm (1 in) or greater in diameter threshold, effective January 2010, an increase over the previous threshold of ¾ inch hail. Other countries will have different thresholds according local sensitivity to hail, for instance grape growing areas could be adversely impacted by smaller hailstones.
Effect of Drought
8:11 AM
Periods of drought can have significant environmental, agricultural, health, economic and social consequences. The effect varies according to vulnerability. For example, subsistence farmers are more likely to migrate during drought because they do not have alternative food sources. Areas with populations that depend on subsistence farming as a major food source are more vulnerable to drought-triggered famine.
Drought can also reduce water quality, because lower water flows reduce dilution of pollutants and increase contamination of remaining water sources. Common consequences of drought include:
- Diminished crop growth or yield productions and carrying capacity for livestock
- Dust bowls, themselves a sign of erosion, which further erode the landscape
- Dust storms, when drought hits an area suffering from desertification and erosion
- Famine due to lack of water for irrigation
- Habitat damage, affecting both terrestrial and aquatic wildlife
- Malnutrition, dehydration and related diseases
- Mass migration, resulting in internal displacement and international refugees
- Reduced electricity production due to reduced water flow through hydroelectric dams
- Shortages of water for industrial users
- Snakes migration and increases in snakebites
- Social unrest
- War over natural resources, including water and food
- Wildfires, such as Australian bushfires, are more common during times of drought
Drought protection and relief
8:07 AM
Strategies for drought protection, mitigation or relief include:
- Dams - many dams and their associated reservoirs supply additional water in times of drought.

- Cloud seeding - an artificial technique to induce rainfall.
- Desalination of sea water for irrigation or consumption.
- Drought monitoring - Continuous observation of rainfall levels and comparisons with current usage levels can help prevent man-made drought. For instance, analysis of water usage in Yemen has revealed that their water table (underground water level) is put at grave risk by over-use to fertilize their Khat crop. Careful monitoring of moisture levels can also help predict increased risk for wildfires, using such metrics as the Keetch-Byram Drought Index or Palmer Drought Index.
- Land use - Carefully planned crop rotation can help to minimize erosion and allow farmers to plant less water-dependent crops in drier years.
- Outdoor water-use restriction - Regulating the use of sprinklers, hoses or buckets on outdoor plants, filling pools, and other water-intensive home maintenance tasks.
- Rainwater harvesting - Collection and storage of rainwater from roofs or other suitable catchments.
- Recycled water - Former wastewater (sewage) that has been treated and purified for reuse.
- Transvasement - Building canals or redirecting rivers as massive attempts at irrigation in drought-prone areas.
Types of Drought
8:06 AM
As a drought persists, the conditions surrounding it gradually worsen and its impact on the local population gradually increases. People tend to define types of droughts in three main ways:
- Meteorological drought is brought about when there is a prolonged period with less than average precipitation. Meteorological drought usually precedes the other kinds of drought.
- Agricultural droughts are droughts that affect crop production or the ecology of the range. This condition can also arise independently from any change in precipitation levels when soil conditions and erosion triggered by poorly planned agricultural endeavors cause a shortfall in water available to the crops. However, in a traditional drought, it is caused by an extended period of below average precipitation.
- Hydrological drought is brought about when the water reserves available in sources such as aquifers, lakes and reservoirs fall below the statistical average. Hydrological drought tends to show up more slowly because it involves stored water that is used but not replenished. Like an agricultural drought, this can be triggered by more than just a loss of rainfall. For instance, Kazakhstan was recently awarded a large amount of money by the World Bank to restore water that had been diverted to other nations from the Aral Sea under Soviet rule. Similar circumstances also place their largest lake, Balkhash, at risk of completely drying out.
Causes of Drought
8:04 AM
Generally, rainfall is related to the amount of water vapor in the atmosphere, combined with the upward forcing of the air mass containing that water vapor. If either of these are reduced, the result is a drought. This can be triggered by an above average prevalence of high pressure systems, winds carrying continental, rather than oceanic air masses (i.e. reduced water content), and ridges of high pressure areas form with behaviors which prevent or restrict the developing of thunderstorm activity or rainfall over one certain region. Oceanic and atmospheric weather cycles such as the El Niño-Southern Oscillation (ENSO) make drought a regular recurring feature of the Americas along the Midwest and Australia. Guns, Germs, and Steel author Jared Diamond sees the stark impact of the multi-year ENSO cycles on Australian weather patterns as a key reason that Australian aborigines remained a hunter-gatherer society rather than adopting agriculture. Another climate oscillation known as the North Atlantic Oscillation has been tied to droughts in northeast Spain.
Human activity can directly trigger exacerbating factors such as over farming, excessive irrigation, deforestation, and erosion adversely impact the ability of the land to capture and hold water. While these tend to be relatively isolated in their scope, activities resulting in global climate change are expected to trigger droughts with a substantial impact on agriculture throughout the world, and especially in developing nations. Overall, global warming will result in increased world rainfall. Along with drought in some areas, flooding and erosion will increase in others. Paradoxically, some proposed solutions to global warming that focus on more active techniques, solar radiation management through the use of a space sunshade for one, may also carry with them increased chances of drought.
What is Drought
7:55 AM

A drought or drouth is an extended period of months or years when a region notes a deficiency in its water supply. Generally, this occurs when a region receives consistently below average precipitation. It can have a substantial impact on the ecosystem and agriculture of the affected region. Although droughts can persist for several years, even a short, intense drought can cause significant damage and harm the local economy.
This global phenomenon has a widespread impact on agriculture. The United Nations estimates that an area of fertile soil the size of Ukraine is lost every year because of drought, deforestation, and climate instability. Lengthy periods of drought have long been a key trigger for mass migration and played a key role in a number of ongoing migrations and other humanitarian crises in the Horn of Africa and the Sahel.
Drought is a normal, recurring feature of the climate in most parts of the world. It is among the earliest documented climatic events, present in the Epic of Gilgamesh and tied to the biblical story of Joseph's arrival in and the later Exodus from Ancient Egypt. Hunter-gatherer migrations in 9,500 BC Chile have been linked to the phenomenon, as has the exodus of early man out of Africa and into the rest of the world around 135,000 years ago.
Modern peoples can effectively mitigate much of the impact of drought through irrigation and crop rotation. Failure to develop adequate drought mitigation strategies carries a grave human cost in the modern era, exacerbated by ever-increasing population densities.
Regions
Recurring droughts leading to desertification in the Horn of Africa have created grave ecological catastrophes, prompting massive food shortages, still recurring. To the north-west of the Horn, the Darfur conflict in neighboring Sudan, also affecting Chad, was fueled by decades of drought; combination of drought, desertification and overpopulation are among the causes of the Darfur conflict, because the Arab Baggara nomads searching for water have to take their livestock further south, to land mainly occupied by non-Arab farming peoples.Approximately 2.4 billion people live in the drainage basin of the Himalayan rivers. India, China, Pakistan, Bangladesh, Nepal and Myanmar could experience floods followed by droughts in coming decades. Drought in India affecting the Ganges is of particular concern, as it provides drinking water and agricultural irrigation for more than 500 million people. The west coast of North America, which gets much of its water from glaciers in mountain ranges such as the Rocky Mountains and Sierra Nevada, also would be affected.
In 2005, parts of the Amazon basin experienced the worst drought in 100 years. A 23 July 2006 article reported Woods Hole Research Center results showing that the forest in its present form could survive only three years of drought. Scientists at the Brazilian National Institute of Amazonian Research argue in the article that this drought response, coupled with the effects of deforestation on regional climate, are pushing the rainforest towards a "tipping point" where it would irreversibly start to die. It concludes that the rainforest is on the brink of being turned into savanna or desert, with catastrophic consequences for the world's climate. According to the WWF, the combination of climate change and deforestation increases the drying effect of dead trees that fuels forest fires.
By far the largest part of Australia is desert or semi-arid lands commonly known as the outback. A 2005 study by Australian and American researchers investigated the desertification of the interior, and suggested that one explanation was related to human settlers who arrived about 50,000 years ago. Regular burning by these settlers could have prevented monsoons from reaching interior Australia. In June 2008 it became known that an expert panel had warned of long term, maybe irreversible, severe ecological damage for the whole Murray-Darling basin if it does not receive sufficient water by October. Australia could experience more severe droughts and they could become more frequent in the future, a government-commissioned report said on July 6, 2008. The Australian of the year 2007, environmentalist Tim Flannery, predicted that unless it made drastic changes, Perth in Western Australia could become the world’s first ghost metropolis, an abandoned city with no more water to sustain its population.
East Africa currently faces its worst drought in decades, with crops and livestock destroyed. The U.N. World Food Programme recently said that nearly four million Kenyans urgently needed food.7.4 Earthquake Struck Alaska
10:37 PM
The first quake occurred at a depth of about 40 km. Soon after the second earthquake measuring 7.2 magnitude occurred in the same area with the same depth. This was conveyed by the U.S. Geological Survey agency.
"Tsunami warning currently enforced and includes coastal areas of Alaska started to Unimak Pass, Alaska (80 miles northeast of Dutch Harbor) to the Amchitka Pass, Alaska (125 miles west adak)," the statement by Alaska Tsunami Warning Center and West Coast as reported by Reuters on Friday (24/06/2011).
Mentioned that an earthquake with the strength of this magnitude is known to cause a tsunami. If a tsunami occurs, the first tsunami wave will reach Adak, Alaska on Thursday, June 23 at 20:12 local time.
With this tsunami warning means all coastal residents who entered the territory of a tsunami warning, which is near the beach or lowland areas should go immediately to higher ground and away from the harbor and bay.
Notable Tropical Cyclone
1:00 AM

Tropical cyclones that cause extreme destruction are rare, although when they occur, they can cause great amounts of damage or thousands of fatalities. The 1970 Bhola cyclone is the deadliest tropical cyclone on record, killing more than 300,000 people and potentially as many as 1 million after striking the densely populated Ganges Delta region of Bangladesh on 13 November 1970. Its powerful storm surge was responsible for the high death toll. The North Indian cyclone basin has historically been the deadliest basin. Elsewhere, Typhoon Nina killed nearly 100,000 in China in 1975 due to a 100-year flood that caused 62 dams including the Banqiao Dam to fail. The Great Hurricane of 1780 is the deadliest Atlantic hurricane on record, killing about 22,000 people in the Lesser Antilles. A tropical cyclone does need not be particularly strong to cause memorable damage, primarily if the deaths are from rainfall or mudslides. Tropical Storm Thelma in November 1991 killed thousands in the Philippines, while in 1982, the unnamed tropical depression that eventually became Hurricane Paul killed around 1,000 people in Central America.
Hurricane Katrina is estimated as the costliest tropical cyclone worldwide, causing $81.2 billion in property damage (2008 USD) with overall damage estimates exceeding $100 billion (2005 USD). Katrina killed at least 1,836 people after striking Louisiana and Mississippi as a major hurricane in August 2005. Hurricane Andrew is the second most destructive tropical cyclone in U.S history, with damages totaling $40.7 billion (2008 USD), and with damage costs at $31.5 billion (2008 USD), Hurricane Ike is the third most destructive tropical cyclone in U.S history. The Galveston Hurricane of 1900 is the deadliest natural disaster in the United States, killing an estimated 6,000 to 12,000 people in Galveston, Texas. Hurricane Mitch caused more than 10,000 fatalities in Latin America. Hurricane Iniki in 1992 was the most powerful storm to strike Hawaii in recorded history, hitting Kauai as a Category 4 hurricane, killing six people, and causing U.S. $3 billion in damage. Other destructive Eastern Pacific hurricanes include Pauline and Kenna, both causing severe damage after striking Mexico as major hurricanes. In March 2004, Cyclone Gafilo struck northeastern Madagascar as a powerful cyclone, killing 74, affecting more than 200,000, and becoming the worst cyclone to affect the nation for more than 20 years.
The most intense storm on record was Typhoon Tip in the northwestern Pacific Ocean in 1979, which reached a minimum pressure of 870 mbar (25.69 inHg) and maximum sustained wind speeds of 165 knots (85 m/s) or 190 miles per hour (310 km/h). Tip, however, does not solely hold the record for fastest sustained winds in a cyclone. Typhoon Keith in the Pacific and Hurricanes Camille and Allen in the North Atlantic currently share this record with Tip.[119] Camille was the only storm to actually strike land while at that intensity, making it, with 165 knots (85 m/s) or 190 miles per hour (310 km/h) sustained winds and 183 knots (94 m/s) or 210 miles per hour (340 km/h) gusts, the strongest tropical cyclone on record at landfall.[120] Typhoon Nancy in 1961 had recorded wind speeds of 185 knots (95 m/s) or 215 miles per hour (346 km/h), but recent research indicates that wind speeds from the 1940s to the 1960s were gauged too high, and this is no longer considered the storm with the highest wind speeds on record. Similarly, a surface-level gust caused by Typhoon Paka on Guam was recorded at 205 knots (105 m/s) or 235 miles per hour (378 km/h). Had it been confirmed, it would be the strongest non-tornadic wind ever recorded on the Earth's surface, but the reading had to be discarded since the anemometer was damaged by the storm.
In addition to being the most intense tropical cyclone on record, Tip was the largest cyclone on record, with tropical storm-force winds 2,170 kilometres (1,350 mi) in diameter. The smallest storm on record, Tropical Storm Marco, formed during October 2008, and made landfall in Veracruz. Marco generated tropical storm-force winds only 37 kilometres (23 mi) in diameter.
Hurricane John is the longest-lasting tropical cyclone on record, lasting 31 days in 1994. Before the advent of satellite imagery in 1961, however, many tropical cyclones were underestimated in their durations. John is also the longest-tracked tropical cyclone in the Northern Hemisphere on record, which had a path of 7,165 miles (13,280 km). Reliable data for Southern Hemisphere cyclones is unavailable.Intensity Classifications of Tropical Cyclone
12:06 PM
Tropical cyclones are classified into three main groups, based on intensity: tropical depressions, tropical storms, and a third group of more intense storms, whose name depends on the region. For example, if a tropical storm in the Northwestern Pacific reaches hurricane-strength winds on the Beaufort scale, it is referred to as a typhoon; if a tropical storm passes the same benchmark in the Northeast Pacific Basin, or in the Atlantic, it is called a hurricane. Neither "hurricane" nor "typhoon" is used in either the Southern Hemisphere or the Indian Ocean. In these basins, storms of tropical nature are referred to simply as "cyclones".
Additionally, as indicated in the table below, each basin uses a separate system of terminology, making comparisons between different basins difficult. In the Pacific Ocean, hurricanes from the Central North Pacific sometimes cross the International Date Line into the Northwest Pacific, becoming typhoons (such as Hurricane/Typhoon Ioke in 2006); on rare occasions, the reverse will occur. It should also be noted that typhoons with sustained winds greater than 67 metres per second (130 kn) or 150 miles per hour (240 km/h) are called Super Typhoons by the Joint Typhoon Warning Center.
Tropical depression
A tropical depression is an organized system of clouds and thunderstorms with a defined, closed surface circulation and maximum sustained winds of less than 17 metres per second (33 kn) or 38 miles per hour (61 km/h). It has no eye and does not typically have the organization or the spiral shape of more powerful storms. However, it is already a low-pressure system, hence the name "depression". The practice of the Philippines is to name tropical depressions from their own naming convention when the depressions are within the Philippines' area of responsibility.
Tropical storm
A tropical storm is an organized system of strong thunderstorms with a defined surface circulation and maximum sustained winds between 17 metres per second (33 kn) (39 miles per hour (63 km/h)) and 32 metres per second (62 kn) (73 miles per hour (117 km/h)). At this point, the distinctive cyclonic shape starts to develop, although an eye is not usually present. Government weather services, other than the Philippines, first assign names to systems that reach this intensity (thus the term named storm).
Hurricane or typhoon
A hurricane or typhoon (sometimes simply referred to as a tropical cyclone, as opposed to a depression or storm) is a system with sustained winds of at least 33 metres per second (64 kn) or 74 miles per hour (119 km/h). A cyclone of this intensity tends to develop an eye, an area of relative calm (and lowest atmospheric pressure) at the center of circulation. The eye is often visible in satellite images as a small, circular, cloud-free spot. Surrounding the eye is the eyewall, an area about 16 kilometres (9.9 mi) to 80 kilometres (50 mi) wide in which the strongest thunderstorms and winds circulate around the storm's center. Maximum sustained winds in the strongest tropical cyclones have been estimated at about 85 metres per second (165 kn) or 195 miles per hour (314 km/h).
| Tropical Cyclone Classifications (all winds are 10-minute averages) | ||||||||
|---|---|---|---|---|---|---|---|---|
| Beaufort scale | 10-minute sustained winds (knots) | N Indian Ocean IMD | SW Indian Ocean MF | Australia BOM | SW Pacific FMS | NW Pacific JMA | NW Pacific JTWC | NE Pacific & N Atlantic NHC, CHC & CPHC |
| 0–6 | <28 knots (32 mph; 52 km/h) | Depression | Trop. Disturbance | Tropical Low | Tropical Depression | Tropical Depression | Tropical Depression | Tropical Depression |
| 7 | 28–29 knots (32–33 mph; 52–54 km/h) | Deep Depression | Depression | |||||
| 30–33 knots (35–38 mph; 56–61 km/h) | Tropical Storm | Tropical Storm | ||||||
| 8–9 | 34–47 knots (39–54 mph; 63–87 km/h) | Cyclonic Storm | Moderate Tropical Storm | Tropical Cyclone (1) | Tropical Cyclone (1) | Tropical Storm | ||
| 10 | 48–55 knots (55–63 mph; 89–102 km/h) | Severe Cyclonic Storm | Severe Tropical Storm | Tropical Cyclone (2) | Tropical Cyclone (2) | Severe Tropical Storm | ||
| 11 | 56–63 knots (64–72 mph; 104–117 km/h) | Typhoon | Hurricane (1) | |||||
| 12 | 64–72 knots (74–83 mph; 119–133 km/h) | Very Severe Cyclonic Storm | Tropical Cyclone | Severe Tropical Cyclone (3) | Severe Tropical Cyclone (3) | Typhoon | ||
| 73–85 knots (84–98 mph; 135–157 km/h) | Hurricane (2) | |||||||
| 86–89 knots (99–102 mph; 159–165 km/h) | Severe Tropical Cyclone (4) | Severe Tropical Cyclone (4) | Major Hurricane (3) | |||||
| 90–99 knots (100–114 mph; 170–183 km/h) | Intense Tropical Cyclone | |||||||
| 100–106 knots (120–122 mph; 190–196 km/h) | Major Hurricane (4) | |||||||
| 107–114 knots (123–131 mph; 198–211 km/h) | Severe Tropical Cyclone (5) | Severe Tropical Cyclone (5) | ||||||
| 115–119 knots (132–137 mph; 213–220 km/h) | Very Intense Tropical Cyclone | Super Typhoon | ||||||
| >120 knots (140 mph; 220 km/h) | Super Cyclonic Storm | Major Hurricane (5) | ||||||
Observation and Forecasting of Tropical Cyclone
11:57 AM
Tropical Cyclone Observation
 Intense tropical cyclones pose a particular observation challenge, as they are a dangerous oceanic phenomenon, and weather stations, being relatively sparse, are rarely available on the site of the storm itself. Surface observations are generally available only if the storm is passing over an island or a coastal area, or if there is a nearby ship. Usually, real-time measurements are taken in the periphery of the cyclone, where conditions are less catastrophic and its true strength cannot be evaluated. For this reason, there are teams of meteorologists that move into the path of tropical cyclones to help evaluate their strength at the point of landfall.
 Tropical cyclones far from land are tracked by weather satellites capturing visible and infrared images from space, usually at half-hour to quarter-hour intervals. As a storm approaches land, it can be observed by land-based Doppler radar. Radar plays a crucial role around landfall by showing a storm's location and intensity every several minutes.
In-situ measurements, in real-time, can be taken by sending specially equipped reconnaissance flights into the cyclone. In the Atlantic basin, these flights are regularly flown by United States government hurricane hunters. The aircraft used are WC-130 Hercules and WP-3D Orions, both four-engine turboprop cargo aircraft. These aircraft fly directly into the cyclone and take direct and remote-sensing measurements. The aircraft also launch GPS dropsondes inside the cyclone. These sondes measure temperature, humidity, pressure, and especially winds between flight level and the ocean's surface. A new era in hurricane observation began when a remotely piloted Aerosonde, a small drone aircraft, was flown through Tropical Storm Ophelia as it passed Virginia's Eastern Shore during the 2005 hurricane season. A similar mission was also completed successfully in the western Pacific ocean. This demonstrated a new way to probe the storms at low altitudes that human pilots seldom dare.
Tropical Cyclone Forecasting
 Because of the forces that affect tropical cyclone tracks, accurate track predictions depend on determining the position and strength of high- and low-pressure areas, and predicting how those areas will change during the life of a tropical system. The deep layer mean flow, or average wind through the depth of the troposphere, is considered the best tool in determining track direction and speed. If storms are significantly sheared, use of wind speed measurements at a lower altitude, such as at the 700 hPa pressure surface (3,000 metres / 9,800 feet above sea level) will produce better predictions. Tropical forecasters also consider smoothing out short-term wobbles of the storm as it allows them to determine a more accurate long-term trajectory. High-speed computers and sophisticated simulation software allow forecasters to produce computer models that predict tropical cyclone tracks based on the future position and strength of high- and low-pressure systems. Combining forecast models with increased understanding of the forces that act on tropical cyclones, as well as with a wealth of data from Earth-orbiting satellites and other sensors, scientists have increased the accuracy of track forecasts over recent decades. However, scientists are not as skillful at predicting the intensity of tropical cyclones. The lack of improvement in intensity forecasting is attributed to the complexity of tropical systems and an incomplete understanding of factors that affect their development.
Effects of Tropical Cyclones
8:34 AM
Tropical cyclones out at sea cause large waves, heavy rain, and high winds, disrupting international shipping and, at times, causing shipwrecks. Tropical cyclones stir up water, leaving a cool wake behind them, which causes the region to be less favorable for subsequent tropical cyclones. On land, strong winds can damage or destroy vehicles, buildings, bridges, and other outside objects, turning loose debris into deadly flying projectiles. The storm surge, or the increase in sea level due to the cyclone, is typically the worst effect from landfalling tropical cyclones, historically resulting in 90% of tropical cyclone deaths. The broad rotation of a landfalling tropical cyclone, and vertical wind shear at its periphery, spawns tornadoes. Tornadoes can also be spawned as a result of eyewall mesovortices, which persist until landfall.
Over the past two centuries, tropical cyclones have been responsible for the deaths of about 1.9 million people worldwide. Large areas of standing water caused by flooding lead to infection, as well as contributing to mosquito-borne illnesses. Crowded evacuees in shelters increase the risk of disease propagation. Tropical cyclones significantly interrupt infrastructure, leading to power outages, bridge destruction, and the hampering of reconstruction efforts.
Although cyclones take an enormous toll in lives and personal property, they may be important factors in the precipitation regimes of places they impact, as they may bring much-needed precipitation to otherwise dry regions. Tropical cyclones also help maintain the global heat balance by moving warm, moist tropical air to the middle latitudes and polar regions. The storm surge and winds of hurricanes may be destructive to human-made structures, but they also stir up the waters of coastal estuaries, which are typically important fish breeding locales. Tropical cyclone destruction spurs redevelopment, greatly increasing local property values.The main effects of tropical cyclones include heavy rain, strong wind, large storm surges at landfall, and tornadoes. The destruction from a tropical cyclone depends mainly on its intensity, its size, and its location. Tropical cyclones act to remove forest canopy as well as change the landscape near coastal areas, by moving and reshaping sand dunes and causing extensive erosion along the coast. Even well inland, heavy rainfall can lead to mudslides and landslides in mountainous areas. Their effects can be sensed over time by studying the concentration of the Oxygen-18 isotope within caves within the vicinity of cyclones' paths.
After the cyclone has passed, devastation often continues. Standing water can cause the spread of disease, and transportation or communications infrastructure may have been destroyed, hampering clean-up and rescue efforts. Nearly two million people have died globally due to tropical cyclones. Despite their devastating effects, tropical cyclones are also beneficial, by potentially bringing rain to dry areas and moving heat from the tropics poleward. Out at sea, ships take advantage of their known characteristics by navigating through their weaker, western half.
Tropical Cyclone Dissipation
8:31 AM
Factors
A tropical cyclone can cease to have tropical characteristics in several different ways. One such way is if it moves over land, thus depriving it of the warm water it needs to power itself, quickly losing strength. Most strong storms lose their strength very rapidly after landfall and become disorganized areas of low pressure within a day or two, or evolve into extratropical cyclones. There is a chance a tropical cyclone could regenerate if it managed to get back over open warm water, such as with Hurricane Ivan. If it remains over mountains for even a short time, weakening will accelerate. Many storm fatalities occur in mountainous terrain, as the dying storm unleashes torrential rainfall, leading to deadly floods and mudslides, similar to those that happened with Hurricane Mitch in 1998. Additionally, dissipation can occur if a storm remains in the same area of ocean for too long, mixing the upper 60 metres (200 ft) of water, dropping sea surface temperatures more than 5 °C (9 °F). Without warm surface water, the storm cannot survive.
A tropical cyclone can dissipate when it moves over waters significantly below 26.5 °C (79.7 °F). This will cause the storm to lose its tropical characteristics (i.e. thunderstorms near the center and warm core) and become a remnant low pressure area, which can persist for several days. This is the main dissipation mechanism in the Northeast Pacific ocean. Weakening or dissipation can occur if it experiences vertical wind shear, causing the convection and heat engine to move away from the center; this normally ceases development of a tropical cyclone. Additionally, its interaction with the main belt of the Westerlies, by means of merging with a nearby frontal zone, can cause tropical cyclones to evolve into extratropical cyclones. This transition can take 1–3 days. Even after a tropical cyclone is said to be extratropical or dissipated, it can still have tropical storm force (or occasionally hurricane/typhoon force) winds and drop several inches of rainfall. In the Pacific ocean and Atlantic ocean, such tropical-derived cyclones of higher latitudes can be violent and may occasionally remain at hurricane or typhoon-force wind speeds when they reach the west coast of North America. These phenomena can also affect Europe, where they are known as European windstorms; Hurricane Iris's extratropical remnants are an example of such a windstorm from 1995. Additionally, a cyclone can merge with another area of low pressure, becoming a larger area of low pressure. This can strengthen the resultant system, although it may no longer be a tropical cyclone. Studies in the 2000s have given rise to the hypothesis that large amounts of dust reduce the strength of tropical cyclones.
Artificial dissipation
In the 1960s and 1970s, the United States government attempted to weaken hurricanes through Project Stormfury by seeding selected storms with silver iodide. It was thought that the seeding would cause supercooled water in the outer rainbands to freeze, causing the inner eyewall to collapse and thus reducing the winds. The winds of Hurricane Debbie—a hurricane seeded in Project Stormfury—dropped as much as 31%, but Debbie regained its strength after each of two seeding forays. In an earlier episode in 1947, disaster struck when a hurricane east of Jacksonville, Florida promptly changed its course after being seeded, and smashed into Savannah, Georgia. Because there was so much uncertainty about the behavior of these storms, the federal government would not approve seeding operations unless the hurricane had a less than 10% chance of making landfall within 48 hours, greatly reducing the number of possible test storms. The project was dropped after it was discovered that eyewall replacement cycles occur naturally in strong hurricanes, casting doubt on the result of the earlier attempts. Today, it is known that silver iodide seeding is not likely to have an effect because the amount of supercooled water in the rainbands of a tropical cyclone is too low.
Other approaches have been suggested over time, including cooling the water under a tropical cyclone by towing icebergs into the tropical oceans. Other ideas range from covering the ocean in a substance that inhibits evaporation, dropping large quantities of ice into the eye at very early stages of development (so that the latent heat is absorbed by the ice, instead of being converted to kinetic energy that would feed the positive feedback loop), or blasting the cyclone apart with nuclear weapons.[18] Project Cirrus even involved throwing dry ice on a cyclone. These approaches all suffer from one flaw above many others: tropical cyclones are simply too large and short-lived for any of the weakening techniques to be practical.